

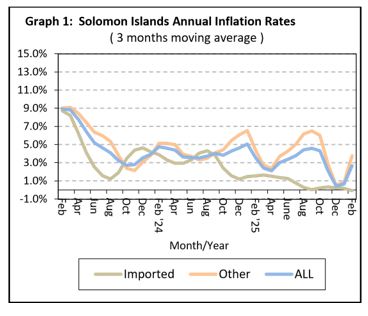
GRAPH 1 - Jan-Feb 2026
National CPI was stable in February after 5.1 percent growth
The National Consumer Price Index (CPI) increased by 5.1 percent to 135.3 in January 2026 and remained stable in February 2026.
The latest report showed through the year, compared to the same months in 2025, the National CPI rose by 3.9 percent and 5.5 percent respectively.
The most significant changes by major expenditure groups from the previous month include:
- Food and Non-Alcoholic Beverages: Jan: (+1.0%), Feb: (+2.2%)
- Alcoholic beverages, tobacco and narcotics: Jan: (+26.5%), Feb: (-3.4%)
- Clothing & footwear: Jan: (-0.1%), Feb: (+0.1%)
- Housing, water, electricity, gas & other fuels: Jan: (+1.6%), Feb: (+0.4%)
- Furnishing, household equipment & routine household maintenance: Jan: (+0.2%), Feb: (+0.1%) Health: Feb: (-0.4%)
- Transport: Jan: (+0.8%), Feb: (-0.9%)
- Education: Jan: (-0.7%), Feb: (+0.1%)
- Restaurants & hotels: Feb: (+0.4%)
The Solomon Islands inflation rate calculated on a 3-months moving average basis was + 0.6% in January 2026 and +2.6% in February. The corresponding inflation rates for imported items was +0.1% in January 2026 and was stable in February while other (domestic) items inflation rate was +0.8% for January 2026 and +3.8% in February 2026.
The Solomon Islands underlying rates of inflation based on a 3-months moving average was observed between +1.2% and +2.5% in January 2026 and +1.6% and +3.0% in February 2026.
The headline inflation rates for the respective provincial towns calculated on a 3-months moving average basis were: Honiara: Jan: (+0.3%) & Feb: +(2.7%); Auki: Jan: (+3.9%) & Feb: (+3.1%); Gizo: Jan: (-0.7%) & Feb: (0.8%); and Noro: Jan: (+2.8%) & Feb: +(2.9%).
The main percentage changes in index by CPI town and expenditure group from the previous month include:
Honiara: Jan:(+5.7%); Feb: (+0.0%)
The most significant changes in movements include:
- Food and Non-Alcoholic Beverages: Jan: (+0.9%); Feb: (+2.8%).
- Alcoholic beverages, tobacco and narcotics: Jan: (+27.8%); Feb: (-3.5%).
- Clothing & footwear: Feb: (+0.1%).
- Housing, water, electricity, gas and other fuels: Jan: (+1.7%); Feb: (+0.4%).
- Furnishings, household equipment & routine household maintenance: Jan: (+0.2%); Feb: (+0.2%).
- Transport: Jan: (+0.5%); Feb: (-0.9%).
- Education: Jan: (-0.3%).
- Restaurants & hotels: Feb: (+0.5%).
Auki: Jan: (+0.4%); Feb: (-1.7%).
The main contributors to the movements were:
- Food and Non-Alcoholic Beverages: Jan: (+0.6%); Feb: (-3.9%).
- Alcoholic beverages, tobacco and narcotics: Jan: (+0.7%); Feb: (+1.8%).
- Clothing & footwear: Jan: (+0.2%); Feb: (-0.1%).
- Housing, water, electricity, gas and other fuels: Jan: (+0.3%); Feb: (+1.2%).
- Furnishings, household equipment & routine household maintenance: Jan: (+1.4%)
- Recreation & culture: Jan: (+0.3%)
- Education: Feb: (+0.7%)
- Restaurants & hotels: Jan (-7.2%)
Gizo: Jan:(+2.8%); Feb: (+1.3%)
The main drivers to these movements were:
- Food and Non-Alcoholic Beverages: Jan:(+3.7%); Feb: (+2.2%).
- Alcoholic beverages, tobacco and narcotics: Jan: (+0.6%); Feb: (+0.7%).
- Clothing & footwear: Jan: (+1.9%); Feb: (+0.2%).
- Housing, water, electricity, gas and other fuels: Jan: (+1.6%); Feb: (+1.4%).
- Furnishings, household equipment & routine household maintenance: Feb: (-0.1%)
- Transport: Jan: (+4.6%); Feb: (+0.3%) Recreation & culture: Jan: (-0.4%)
- Education: Jan: (+2.4%).
- Miscellaneous goods & services: Jan: (+0.3%).
Noro: Jan:(+0.8%); Feb: (-0.8%)
The main contributors to the movements were:
- Food and Non-Alcoholic Beverages: Jan:(-0.3%); Feb: (-0.5%)
- Alcoholic beverages, tobacco and narcotics: Jan:(+7.6%); Feb: (-4.5%).
- Housing, water, electricity, gas and other fuels: Jan:(+0.4%); Feb: (+0.6%).
- Furnishings, household equipment & routine household maintenance: Feb: (-0.5%)
- Transport: Jan:(+2.4%);
- Education: Jan: (-12.7%)
ENDS.///
– SINSO Press release
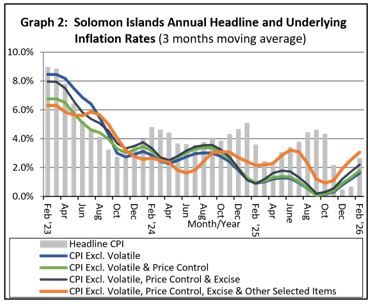
GRAPH 2 – Jan-Feb 2026
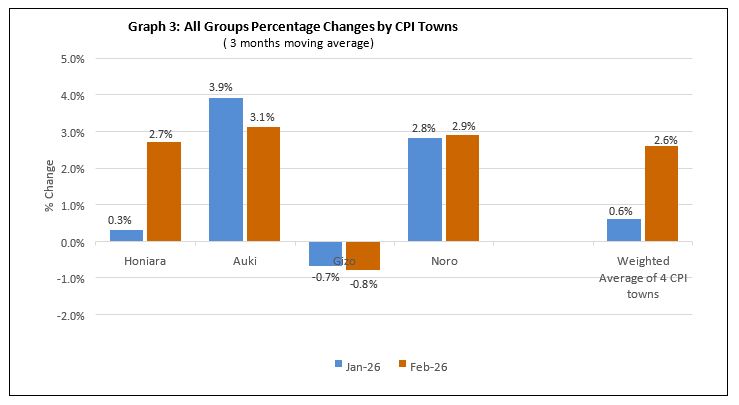
GRAPH 3 – Jan-Feb 2026